
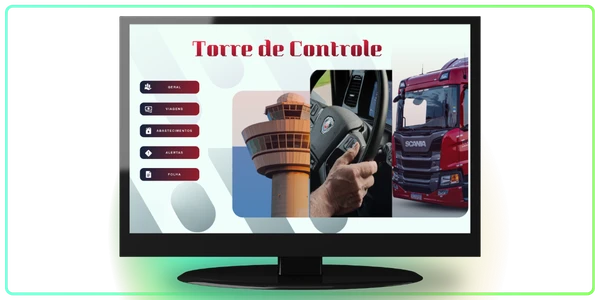
The project
From problem to solution.
Challenge
Integrate the information of one of Brazil's largest road transport companies to efficiently monitor and strategically manage its drivers and operations.
Solution
A Control Tower for visual fleet management: a centralized, real-time system to monitor and analyze driver performance.
Inside the Control Tower
Five tabs, the entire fleet at a glance.
Overview tab
Driving KPIs per driver, interactive map with the fleet's last location and cargo details.
Payroll tab
Pay, benefits, payroll taxes and costs associated with each driver.
Trips tab
Details of each trip and cargo type, searchable by license plate or driver name.
Alerts tab
All telemetry alerts, with incident locations and, when available, images.
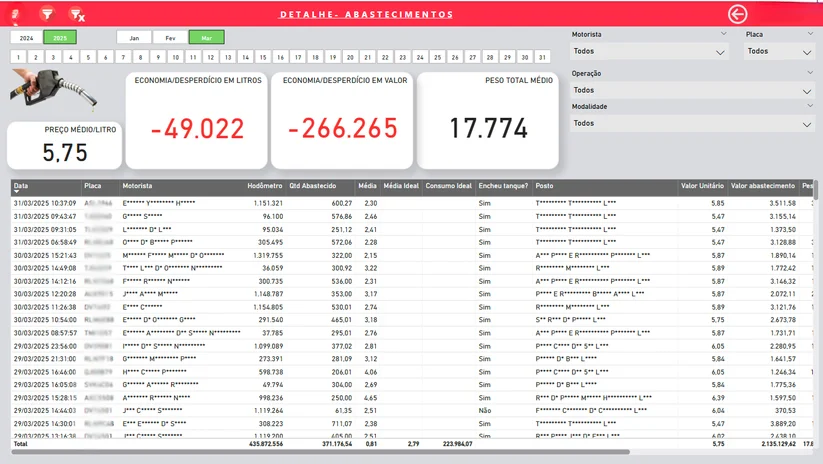
Fueling tab
Actual vs. ideal average consumption, whether the driver drives economically, and the amount saved or overspent.
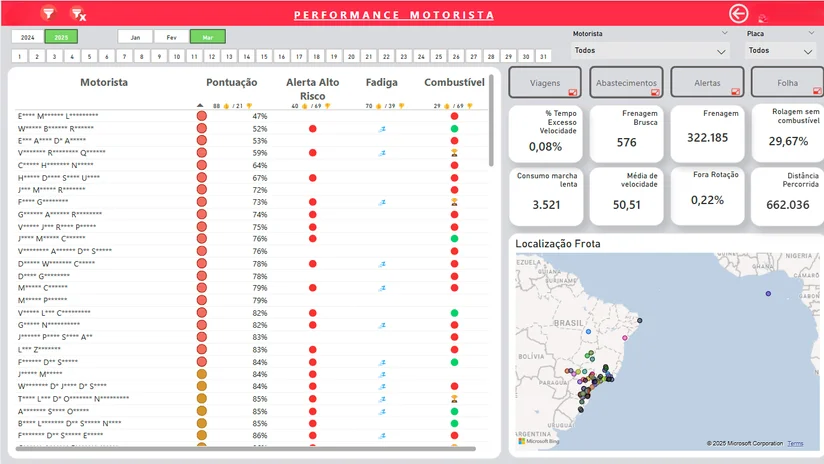
Overview tab: driver performance and fleet location on the map
Gains
What changed in operations.
Organization
Monitoring, telemetry, payroll, geolocation, fueling and trips, all integrated.
Strategic management
More efficiency, safety and savings, with fast evidence-based decisions.
Visibility
Integrated data and dynamic real-time visualization.
Anticipation
Driving details for each driver to intervene immediately on risky behavior.